May 2021 Food Blog Side Hustle Income Report: $2,963.42
How my part-time food blog side hustle made $2,963.42 in May 2021! I share my strategies for taking your blog side hustle from hobby to business one post, and one month, at a time.
Want to Save This Recipe?
Enter your email & I’ll send it to your inbox. Plus, get new plant-based recipes in your inbox!
By submitting this form, you consent to receive emails from Fork in the Road.
Welcome to the May 2021 Fork in the Road income report! If this is your first time reading one of our monthly traffic and income reports, my name is Kristina and I am a registered dietitian and the face behind this plant-based recipe and sustainable kitchen blog. Find out more about the and the content shared on Fork in the Road here.
If you’re new to my income reports, make sure to check out my last update — April 2021 food blog income report — to get caught up.
Ready to learn how Fork in the Road grew in February? Read on for my income and traffic report, my analysis of what worked (and what didn’t) and the goals I’m working toward in months to come.
If this is not your first time reading a Fork in the Road income report, you can skip this section and head right to the income and traffic report below.
You might be wondering why I am sharing how much money I make from my food blog with the world. Why would I want to put myself out there and share the nitty gritty details of the money this blog is bringing in?
The main reason for sharing this information is to inspire you to start taking your own blog seriously. I found other food blog income reports very inspirational in my own food blogging journey, and reading about other bloggers’ successes (and failures) has been invaluable over when I was low on motivation and needed a push to keep going.
I especially want to share because so many blog income reports are from established bloggers who are raking in tens of thousands of dollars, and I want to show what realistic growth (and the inevitable plateaus) look like when you’re also working a full time job. No one starts out bringing in the big bucks, it happens with time and consistency (the latter of which I sometimes lack!).
The other reason for sharing is a bit more selfish: while I’ve done well creating new content and mastering food photography, I haven’t been great at tracking my own progress and setting attainable monetary and business growth goals.
I have a ton of ideas for the blog, but sometimes not a lot of follow-through due to time restraints and not knowing where to start on everything I want to accomplish. Sharing my monthly food blog side hustle reports with you is a way for me to stay accountable.
In these reports I share a month-by-month analysis of what I’m working on, how the blog has grown, what’s working and what isn’t, and my goals for the future. I share this to stay accountable and so that you can learn and be inspired to keep going with your food blog journey as well.
💰 May 2021 Income Report
| Month | #Posts | #Views | $Ads | $Affiliate | $Other | $Total |
|---|---|---|---|---|---|---|
| Aug-20 | 3 | 49,495 | $917.18 | $46.20 | $300 | $1,263.38 |
| Sep-20 | 5 | 42,190 | $959.19 | $49.46 | $250 | $1,258.65 |
| Oct-20 | 6 | 43,508 | $1,340.78 | $49.46 | $250 | $1,640.24 |
| Nov-20 | 4 | 45,683 | $2,024.79 | $79.85 | $150 | $2,254.64 |
| Dec-20 | 4 | 53,027 | $2,605.78 | $98.94 | $250 | $2,954.72 |
| Jan-21 | 19 | 61,107 | $1,737.18 | $315.99 | $0 | $2,078.17 |
| Feb-21 | 4 | 54,754 | $1,694.57 | $89.03 | $0 | $1,783.60 |
| Mar-21 | 1 | 70,851 | $2,308.82 | $23.97 | $0 | $2,332.79 |
| Apr-21 | 8 | 70,013 | $2,293.14 | $73.92 | $0 | $2,367.06 |
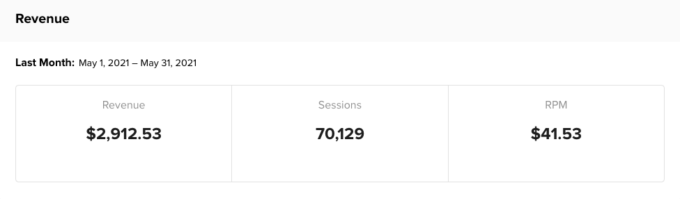
| May-21 | 14 | 80,015 | $2,912.53 | $50.89 | $0 | $2,963.42 |
TOTAL INCOME: $2,963.42
- Display Ads: $2,912.53 (Mediavine)
- Affiliate Marketing: $50.89
- Feast Design Co: $25.00
- Amazon Associates: $18.89
- Food Blogger Pro: $7.00
TOTAL EXPENSES: $954.14
- Website Upkeep Total: $72
- Website hosting: $11 (Cloudways)
- Website tech/development: $47 (iMarkCreative)
- Tasty Links: $4* (automatic linking plugin)
- Photography + Video Total: $42.94
- Adobe Creative Cloud: $29.99
- Canva: $12.95
- SEO + Keyword Research Tools Total: $37
- SEMrush: $25 (shared account with other bloggers)
- Keysearch: $12
- Email service provider: $79* (Kartra)
- Content + social media management: $14.95
- Later: free plan
- Tailwind: $14.95*
- Learning (courses, ebooks, memberships, etc.): $308.25
- HashtagJeff SEO membership: $8.25*
- Creative Course Collective: $300*
- Virtual Assistants: $400.00
+Expenses with a plus sign are new for the month and explained in the expense review below.
*Expenses listed with an asterisk are paid annually to take advantage of annual discounts, but I include the monthly amount here to show how much the blog costs to run each month.
**Expenses crossed out are those that I paid for last month but decided not to pay for going forward. I leave these here for the first month I don’t pay for them to show how expenses change month-to-month.
NET PROFIT: $2,009.28
Income + Expense Review
Let’s talk about expenses…
Let’s dive a bit deeper into the way Fork in the Road created income in May 2021.
Display Ads
Another great month for display ad income. I was thisclose to earning $3000 from ads, which is a big milestone (can we make it happen in June?!?).
As I’ve mentioned in past month reports, my RPMs are very high with Mediavine and went even higher in May. My average RPM for the month was $41.53, which means most days it was even higher. In fact, there were some days I had $47 RPMs…in May! It’s unbelievable.
Over the past couple of months I’ve had a few fellow bloggers reach out and ask me about how to increase their RPMs. While each blog is completely different, one thing that I know makes a huge difference is content length and content formatting. If you’re interested in more information, leave a comment and I may write another case study post about how I increased my RPMs simply by reformatting my posts.
Affiliate Marketing
Affiliate marketing is when a blogger promotes another brand’s product or service and receives a small commission if the reader purchases after clicking through an affiliate link.
Affiliate revenue was about $50 this month, nothing to write home about. I feel like a broken record each month saying it’s a goal to increase affiliate commissions, but now that I am growing a team I will finally have some brain space to devote to increasing other revenue streams — and affiliate income is first on my list.
Sponsored Posts
I’m currently not pursuing sponsored post work. If I was approached by a company that aligned with the site, I would definitely work with them, but right now I’m not using my limited time to pitch sponsored work to brands. I much prefer to focus on passive income streams.
Income Takeaway
A great income month for the blog! In fact, this may be the highest earning month so far from strictly blog-related income (I still do some freelance work I don’t share in these reports). The blog was SO CLOSE to earning $3000, can we cross that milestone next month?
Expenses Takeaway
May’s expenses stayed about the same for the month. I was a part of a mastermind that ended and I did not continue to pay for, so that expense was deleted from this month. In the coming months I’d like to audit my expenses and see where I’m spending money that isn’t necessary because I have a sneaky habit of paying for services (and courses!) that I really don’t use or need.
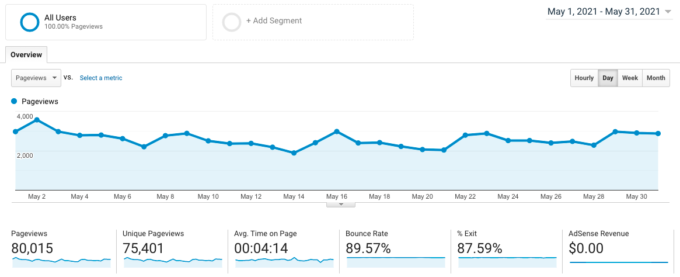
📈 May 2021 Traffic Report
May 2021 traffic: 80,015 pageviews
This is +14% from April 2021 last month and +121% from May 2020 last year!
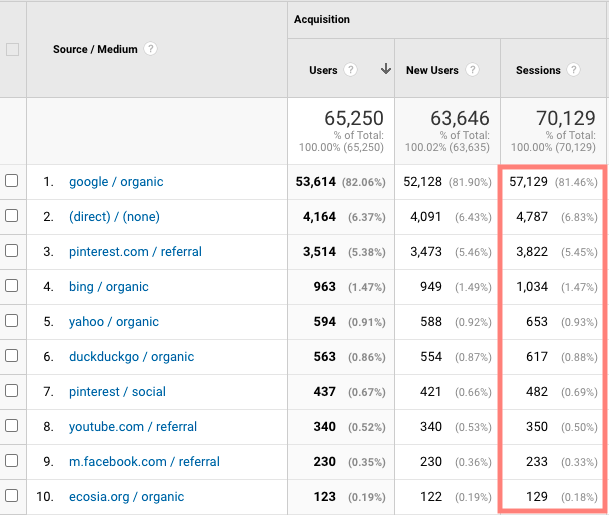
Top ten traffic sources for May 2021
New content in May 2021
- New recipe posts: 7 new posts, 4 updated posts
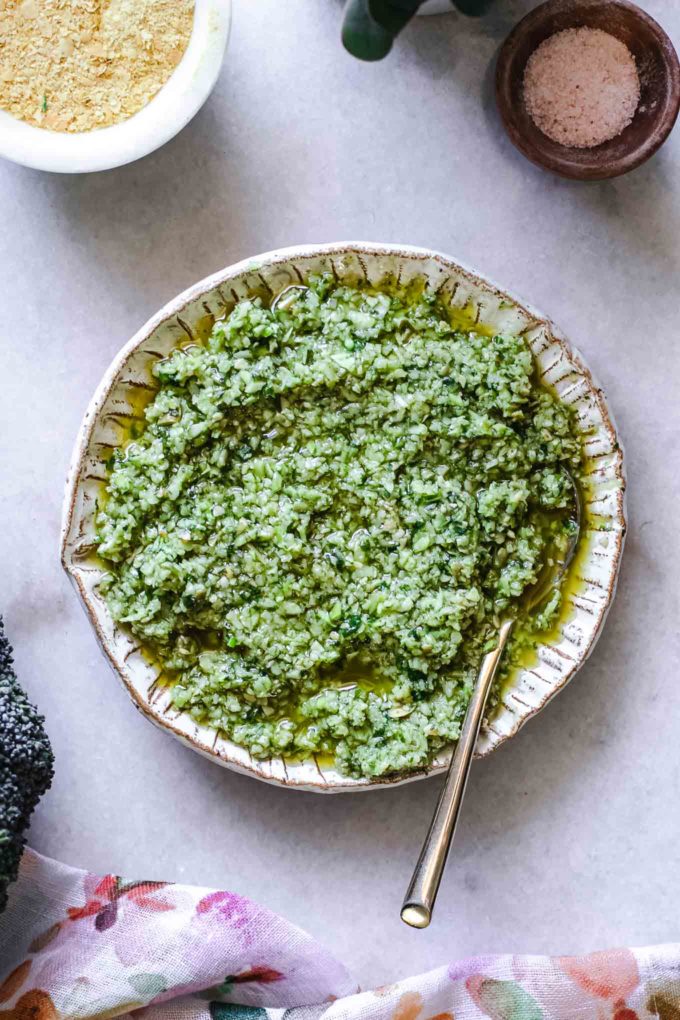
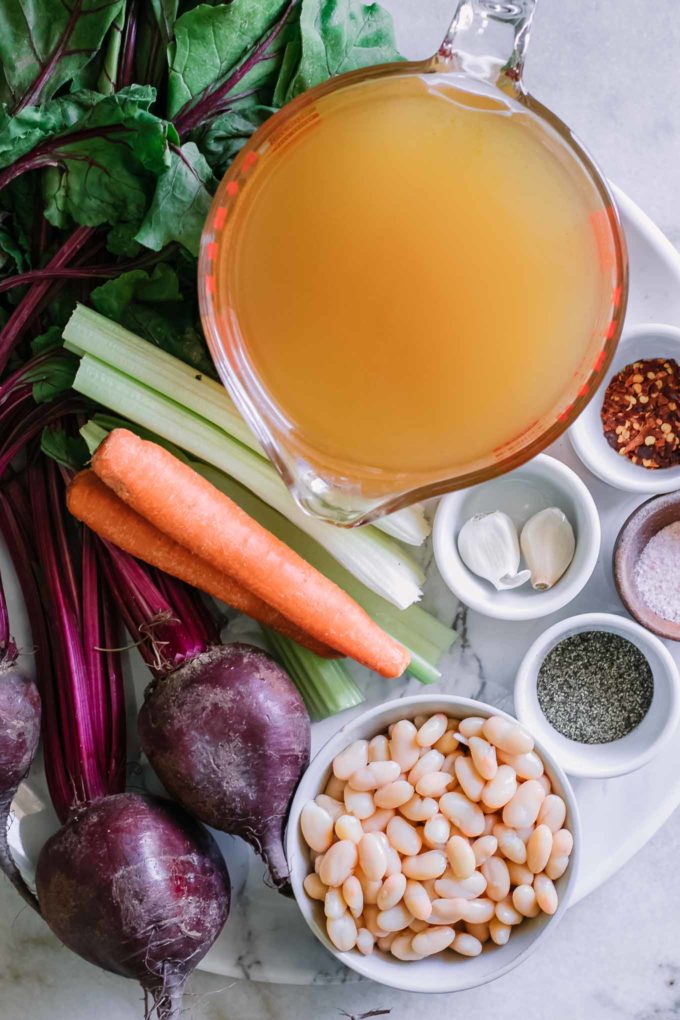
- Broccoli Stem Pesto
- Beet Greens Vegetable Soup
- Vegan Cilantro Pesto
- Sunflower Seed Pesto
- Pumpkin Seed Pesto Sauce
- Roasted Carrots and Parsnips
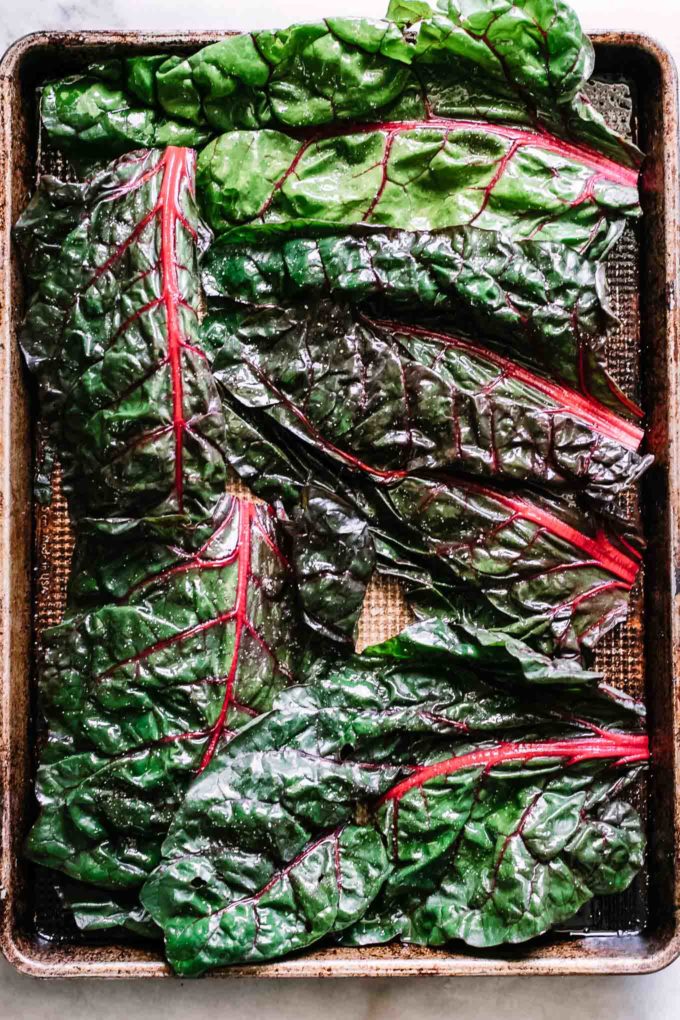
- Baked Chard Chips
- Spicy Lemon Arugula Penne (updated)
- Homemade Golden Milk Spice Mix (updated)
- Iced Golden Milk Latte (updated)
- Ruby Red Grapefruit Margarita (updated)
- New green guides: 2 new posts
- New resources posts: 1 new blogging resource
- New videos: 0
Traffic takeaway
The site (barely) surpassed 80,000 pageviews! This is an exciting milestone, and even more exciting that it was almost exactly 10,000 more pageview than April and was almost DOUBLE the pageviews the site had in May 2021.
I’ve mentioned in past reports, but this time last year was a very low time for the site. I had been hit by multiple algorithm updates and had not had any significant growth in over a year. It was the height of the pandemic, and other food bloggers were experiencing huge surges in traffic but my site was dying a slow death. I was almost ready to throw in the towel, it was a very frustrating time.
Then in June/July of 2020 I decided to stop throwing myself a pity party and get down to work to figure out how to turn things around. I ended up learning A LOT about search engine optimization and implementing some new content strategies I had not seeing in many of the food blogging groups I had been a part of for years.
This strategy paid off…slowly. You can see on the traffic table at the top of this section that in August my numbers started to rise, and now almost a year later I’ve almost doubled my traffic and my income.
It’s very satisfying to see a year of hard work paying off and I’m very excited to see what will happen in the future. Barring another hit from an algorithm (you never know what will happen!), I think the site is primed for exponential growth going into quarters 3 and 4 this year.
Watch this space!
💌 Email List Growth
~1100 subscribers (+104 new subscribers in May 2021)
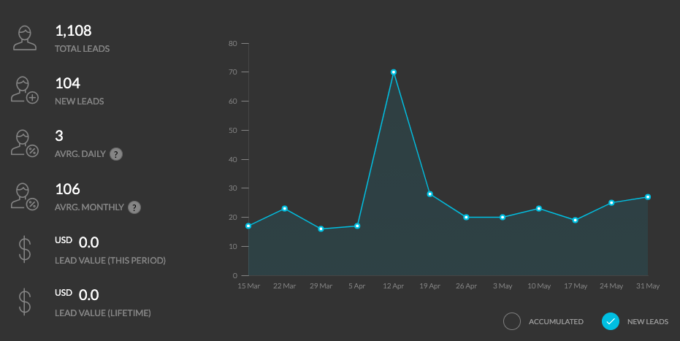
I gained about 100 new subscribers in May, which put me right at about 1100 subscribers. However, this list is still very cold as I haven’t communicated to them regularly in months (years? ever?). Another thing in my (very long) to do list!

💸 May 2021 RPM: $37.04
What is RPM? RPM is Revenue per Mille, or the amount of revenue per 1,000 pageviews. The formula for RPM is:
RPM = (estimated earnings / number of pageviews) * 1000
($2,963.42/ 80,015) * 1000 = $37.04
In May 2021 the blog earned $2,963.42 and had 80,015 pageviews, which means the RPM was $37.04. This means that for every 1000 pageviews the blog received, it generated $37.04 (note that this number is actually lower than my ad company RPM totals because my ad company takes a percentage of my earnings).
📌 May 2021 Summary + Goals
Accountability is key
Last month I mentioned that Val from Thyme and Joy and I started staying accountable to one another by checking in each morning and evening (and throughout the day) with video messages to stay on track for our goals.
UPDATE: I cannot tell you how incredibly valuable this has been for the blog’s growth, but also for me personally.
If you’ve been reading these income reports for awhile now, you’ll know that I’ve always struggled with time and consistency. I had a ton of ideas but with a full-time job (and a crazy toddler), it’s very hard to stay on track.
Having someone to check in with, run ideas past, and stay accountable to has been pivotal for this blog’s growth — just look at the numbers! In the past two months I have grown the traffic and income by almost 20%.
So I highly suggest joining a mastermind or finding a blogging buddy to keep pushing forward!
Systems + scaling
I also mentioned in last month’s report that I was building a team of virtual assistants. I can happily report that in May I had two onboarded and I have another starting in June!
It’s been a lot of work to get everything out of my brain and into videos, tutorials, and other training materials to get everyone up to speed. I’ve had to think through the systems I’m using (or lack thereof) and get things organized so that multiple people can be working on content at the same time.
This has meant auditing the way I currently do things so things are automated and available to everyone. This is no small feat, considering I’ve been blogging solo for years and things are in many places (Dropbox, Google Drive, Evernote, Notion, Clickup, Asana… I’ve tried them all).
For the past year I’ve been using a program called Notion, which I absolutely LOVE. While it’s excellent for writing and building a knowledge library, it’s not a great task manager. And if you’re a blogger (especially a food blogger!) you know that each piece of content has a lot of moving pieces that need to be tracked.
So after much deliberation and feet dragging, I’ve decided to move to Clickup. It’s not the most intuitive program, but I had to look past my love of clean user experience and look at what I want to the tool to do for me long-term as the business grows.
If you’re interested in my systems and how I used Clickup, leave a comment and I’ll try to put together a post on my content calendar and organization process. It’s not perfect yet, but I’m making strides to a well-oiled content machine.
Goals for next month
Last month I finally hit my consistent content goal of posting at least 3 time a week! Because I’m spending a lot of time onboarding and training this month, I’m going to continue that goal in June with the hopes of picking up content production in July.
June’s blogging goals are:
- Post 3 times a week, ideally Monday, Wednesday, and Friday
- Update at least 5 older posts
- Finally finish the e-book I’ve had on my list for…4 months now (ugh)
If you’d like to follow along on my journey, sign up below for email updates!
Thanks for sticking it out and reading Fork in the Road’s journey!
Make sure to check out the Food Blogging Resources page for past income reports and blogging tips, and sign up below to receive emails when new reports and blogging resources are live.
Do you have a food blogging question you want answered in a future report? Want to commiserate on your own blog traffic or income? Leave a comment below or contact me!