July 2021 Food Blog Side Hustle Income Report: $3,379.83
How my part-time food blog side hustle made $3,379.83 in July 2021! I share my strategies for taking your blog side hustle from hobby to business one post, and one month, at a time.
Want to Save This Recipe?
Enter your email & I’ll send it to your inbox. Plus, get new plant-based recipes in your inbox!
By submitting this form, you consent to receive emails from Fork in the Road.
Welcome to the July 2021 Fork in the Road income report! If this is your first time reading one of our monthly traffic and income reports, my name is Kristina and I am a registered dietitian and the face behind this plant-based recipe and sustainable kitchen blog. Find out more about the site and the content shared on Fork in the Road here.
If you’re new to my income reports, make sure to check out my last update — June 2021 food blog income report — to get caught up.
Ready to learn how Fork in the Road grew in June? Read on for my income and traffic report, my analysis of what worked (and what didn’t) and the goals I’m working toward in months to come.
If this is not your first time reading a Fork in the Road income report, you can skip this section and head right to the income and traffic report below.
You might be wondering why I am sharing how much money I make from my food blog with the world. Why would I want to put myself out there and share the nitty gritty details of the money this blog is bringing in?
The main reason for sharing this information is to inspire you to start taking your own blog seriously. I found other food blog income reports very inspirational in my own food blogging journey, and reading about other bloggers’ successes (and failures) has been invaluable over when I was low on motivation and needed a push to keep going.
I especially want to share because so many blog income reports are from established bloggers who are raking in tens of thousands of dollars, and I want to show what realistic growth (and the inevitable plateaus) look like when you’re also working a full time job. No one starts out bringing in the big bucks, it happens with time and consistency (the latter of which I sometimes lack!).
The other reason for sharing is a bit more selfish: while I’ve done well creating new content and mastering food photography, I haven’t been great at tracking my own progress and setting attainable monetary and business growth goals.
I have a ton of ideas for the blog, but sometimes not a lot of follow-through due to time restraints and not knowing where to start on everything I want to accomplish. Sharing my monthly food blog side hustle reports with you is a way for me to stay accountable.
In these reports I share a month-by-month analysis of what I’m working on, how the blog has grown, what’s working and what isn’t, and my goals for the future. I share this to stay accountable and so that you can learn and be inspired to keep going with your food blog journey as well.
💰 July 2021 Income Report
| Month | #Posts | #Views | $Ads | $Affiliate | $Other | $Total |
|---|---|---|---|---|---|---|
| Aug-20 | 3 | 49,495 | $917.18 | $46.20 | $300 | $1,263.38 |
| Sep-20 | 5 | 42,190 | $959.19 | $49.46 | $250 | $1,258.65 |
| Oct-20 | 6 | 43,508 | $1,340.78 | $49.46 | $250 | $1,640.24 |
| Nov-20 | 4 | 45,683 | $2,024.79 | $79.85 | $150 | $2,254.64 |
| Dec-20 | 4 | 53,027 | $2,605.78 | $98.94 | $250 | $2,954.72 |
| Jan-21 | 19 | 61,107 | $1,737.18 | $315.99 | $0 | $2,078.17 |
| Feb-21 | 4 | 54,754 | $1,694.57 | $89.03 | $0 | $1,783.60 |
| Mar-21 | 1 | 70,851 | $2,308.82 | $23.97 | $0 | $2,332.79 |
| Apr-21 | 8 | 70,013 | $2,293.14 | $73.92 | $0 | $2,367.06 |
| May-21 | 14 | 80,015 | $2,912.53 | $50.89 | $0 | $2,963.42 |
| June-21 | 13 | 71,971 | $3,177.92 | $201.13 | $0 | $3,379.05 |
| July-21 | 16 | 82,509 | $3,374.50 | $5.33 | $0 | $3,379.83 |
TOTAL INCOME: $3,379.83
- Display Ads: $3,374.50 (Mediavine)
- Affiliate Marketing: $5.33
- Amazon Associates: $5.33
TOTAL EXPENSES: $1804.14
- Website Upkeep Total: $72
- Website hosting: $11 (Cloudways)
- Website tech/development: $47 (iMarkCreative)
- Tasty Links: $4* (automatic linking plugin)
- Photography + Video Total: $42.94
- Adobe Creative Cloud: $29.99
- Canva: $12.95
- SEO + Keyword Research Tools Total: $37
- SEMrush: $25 (shared account with other bloggers)
- Keysearch: $12
- Email service provider: $79* (Kartra)
- Content + social media management: $14.95
- Tailwind: $14.95*
- Learning (courses, ebooks, memberships, etc.): $308.25
- HashtagJeff SEO membership: $8.25*
- Creative Course Collective: $300*
- Writer + Virtual Assistant: $1250.00
+Expenses with a plus sign are new for the month and explained in the expense review below.
*Expenses listed with an asterisk are paid annually to take advantage of annual discounts, but I include the monthly amount here to show how much the blog costs to run each month.
**Expenses crossed out are those that I paid for last month but decided not to pay for going forward. I leave these here for the first month I don’t pay for them to show how expenses change month-to-month.
NET PROFIT: $1,575.69*
*Note that the numbers here are an estimate and are not reflective of actual money in and out for the month. I report money earned, not received, for the current month as my ad company pays two months after money is earned. I am also showing a breakdown of expenses to give you an idea of how much it costs to run a blog every month, however many of these are paid annually and not monthly.
Income + Expense Review
Let’s talk about income…
Display ad income continue to be great this month, making this the second month in a row that I’ve hit over $3000 and also the second month in a row that I’ve hit my highest display ad income levels in the history of the site.
While ad income was up, this was because a Google algorithm update gave the site an inflated bump in traffic in the beginning of July. This high traffic didn’t last through the entire month and by the end of July I was back to more realistic numbers (more on this in the traffic section below).
Affiliate income was laughable (again). Last month was a fluke with over $200 but this month I had a whopping $5 in affiliate commissions.
Expenses Takeaway
June’s expenses were higher than normal because this was the first time I had both my writer and my admin virtual assistant on for a full month. And spending $1200+ of the blog’s income on outsourcing might seem like a lot when it’s only bringing in $3400 a month, but I can promise you this was money very well spent.
I was able to output more content consistently than I have ever done in the past, and I actually worked ahead and am now scheduling content for a week out. I only wish I would have outsourced sooner!
📈 July 2021 Traffic Report
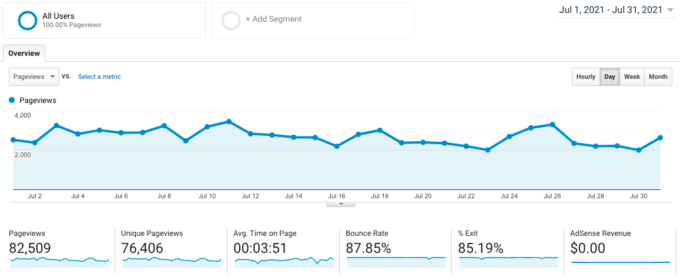
July 2021 traffic: 82,509 pageviews
This is +15% from June 2021 last month and +95% from July 2020 last year.
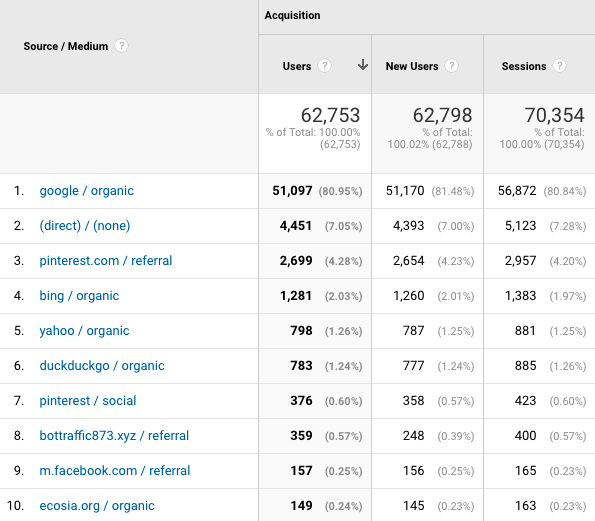
Top ten traffic sources for July 2021
New content in July 2021: 16 total posts
- New recipe posts: 6 new recipes, 3 updated older recipes (new photos, complete rewrites)
- New green guides: 5 new green living guides, 1 updated green living post
- New resources posts: 1 new blogging resource (income report)
- New videos: 0
Traffic takeaway
I mentioned in June’s report that I believe the site was negatively affected by one of the algorithm updates that happened in June (yes, there was more than one update). I also mentioned that traffic was trending up at the beginning of July.
Well, traffic was up for about two weeks in July, then it came down again for the last two months of the week.
I’ve found that this seems to happen every couple of months: for about two weeks I have very high impressions and click throughs showing on my Google Search Console, then it all stops one day.
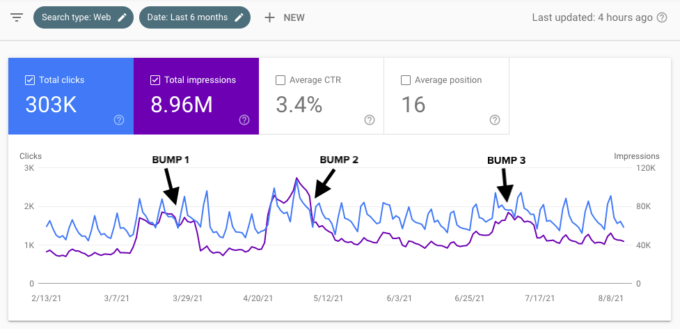
The above is a screenshot of Fork in the Road’s last six months of search performance in Google Search Console. You can clearly see three anamolies:
- March 14th – March 31st: Uptick in impressions and slight uptick in clicks
- April 23rd – May 7th: Very inflated impressions and clicks
- June 28th – July 15th: Slight uptick in impressions and clicks, saw much higher search traffic during week and didn’t have as much of a weekly dip as usual
I share all of this to say that Google is constantly switching things up, they have hundreds (if not thousands) of algorithm updates a year. And I’m able to see the results of this more than some others because 80%+ of my traffic is from organic search, so when there is a slight update I can tell right away.
Having said all of this, July was the highest traffic month the site has ever seen at over 82,000 pageviews. And this was in July, usually one of the lowest months of the year!
💌 Email List Growth
~1250 subscribers (+100ish new subscribers in July 2021)
I gained about 100 or so new email subscribers in July, for a total of about 1300 total subscribers. However, this is a VERY COLD list. I have not communicated with them for months (years?) and I suspect many would unsubscribe when I send out a new email.
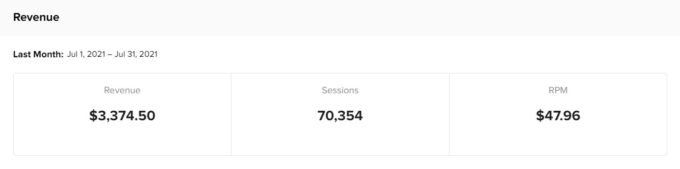
💸 July 2021 RPM: $37.04
What is RPM? RPM is Revenue per Mille, or the amount of revenue per 1,000 pageviews. The formula for RPM is:
RPM = (estimated earnings / number of pageviews) * 1000
($3,379.83/ 82,509) * 1000 = $40.96
In July 2021 the blog earned $3,379.83 and had 82,509 pageviews, which means the total RPM for all income sources was $40.96. This means that for every 1000 pageviews the blog received, it generated $40.96 (note that this number is actually lower than my ad company RPM totals because my ad company takes a percentage of my earnings).
👩💻 Other Sites
Though I absolutely LOVE Fork in the Road and it will always be my blogging baby, my goal is to have a portfolio of websites and I even want to test the waters with buying and flipping websites in the future.
To keep you up-to-date on how I’m working on these goals, I’m adding this new “Other Sites” section to my income reports.
Site #2: A new recipe blog partnership
I mentioned last month that I started a second site with Val from Thyme and Joy. We spent most of June getting the framework of the site up with hosting, themes, plugins, and all of the little things I completely forgot about that take more time than I remembered.
Then in July our focus was on one thing: content.
We ended the month with a total of 10 posts on the blog and started to see some that some of our posts were being indexed by Google, even with no clicks yet.
I have to say that having a second site has been interesting because it’s forced me to look at both sites from a macro level, instead of feeling like I’m “in it” all the time with Fork in the Road.
But both Val and I also struggled with our own personal demons, as we call them. Getting into a groove with writing, shooting, and posting content in a completely new niche on a completely new site was humbling.
So nothing major to share except that the site is live and we’re continuing to pump out content at a pace that’s comfortable for us, but much more together than we could both ever do alone. Watch this space for more updates in the future.
Oh…and I may have bought three other domain names for other future site ideas. 😬
📌 July 2021 Summary + Goals
July was a GREAT month in many ways, but here are the big highlights:
- Had the highest earning month EVER
- Pushed out 16 new pieces of content
- The post production systems I set up in Clickup were refined
- The second blog finally went live with content!
Overall July was a great month for the blog: it reached it’s highest traffic month ever (in the summer, can you believe it?) and it also had it’s highest earnings month.
Typically summers are VERY SLOW for food bloggers. In fact, most call it the “summer slump” because it’s such a drastic change when compared to the high numbers food bloggers see during the holidays.
I attribute Fork in the Road’s traffic and earnings growth to a few things:
- Consistency. I have never in the life of this website posted as consistently as I have in the last few months.
- Solid keyword research targeting low competition keywords. In the past year I have refined my keyword research strategy to ONLY target low competition keywords, and in most cases very low volume compared to the levels that other bloggers seem to go after. This means I’m ranking fast because I’m not competing for huge search terms that every other food blogger is trying to get (I’m looking at you “banana bread”).
- Updating old posts. I regularly go back to older posts and do complete rewrites targeting keywords they posts are already ranking for.
- Formatting my posts with lots of headers, lists, line breaks, etc. If you look at my recipes, you will see they are almost all formatted in the exactly the same way. This not only helps readers as they scroll the page, it also helps break up content so more ads can be served AND makes it super easy for me to write recipe posts as I have a template (and I don’t have to start from scratch every time).
Goals update
July’s blogging goals were:
- Post every other day ✅
- Get at least one week ahead on content ✅
- FINALLY FINISH THIS E-BOOK ❌ (it’s drafted, just not designed)
Augusts’s blogging goals are to:
- Continue to post every other day
- Stay one week ahead on content
- Simplify my systems a bit, I have too many things in too many places
I’m keeping it simple again for August because at the time of this writing (mid-August) I can already feel myself approaching burn out. So to combat this I’m going to be doing the minimum of continuing to post, but not overloading myself with other projects that I know I won’t have the time or mental bandwidth to keep up with.
If you’d like to follow along on my journey, sign up below for email updates!
👉 Want to skip ahead to next month’s post? Click here to read the August 2021 income report for Fork in the Road.
Thanks for sticking it out and reading Fork in the Road’s journey!
Make sure to check out the Food Blogging Resources page for past income reports and blogging tips, and sign up below to receive emails when new reports and blogging resources are live.
Do you have a food blogging question you want answered in a future report? Want to commiserate on your own blog traffic or income? Leave a comment below or contact me!