July 2020 Food Blog Side Hustle Income Report: $1047.14
How my part-time food blog side hustle made $1147.14 in July 2020! I share my strategies for taking your blog side hustle from hobby to business one post, and one month, at a time.
Want to Save This Recipe?
Enter your email & I’ll send it to your inbox. Plus, get new plant-based recipes in your inbox!
By submitting this form, you consent to receive emails from Fork in the Road.
Welcome to the July 2020 Fork in the Road income report! If this is your first time reading one of our monthly traffic and income reports, my name is Kristina and I am a registered dietitian and the face behind this plant-forward recipe and sustainable living blog. Find out more about what we do at Fork in the Road here.
If you’re new to my income reports, make sure to check out my last report — June 2020 food blog income report — where I shared that I wanted to put a stronger focus on content output in July 2020.
Though I didn’t meet my content production goals in July (though you’ll see below I had a good reason why), I did see some pretty drastic changes in traffic, which resulted in revenue increases from both display ads and affiliates.
Ready to learn how Fork in the Road grew in July 2020? Read on for my income and traffic report, my analysis of what worked (and what didn’t) and the goals I’m working toward for August.
[mailerlite_form form_id=4]If this is not your first time reading a Fork in the Road income report, you can skip this section and head right to the income and traffic report below.
You might be wondering why I am sharing how much money I made from my food blog with the world. Why would I want to put myself out there and share the nitty gritty details of the money this blog is bringing in?
The main reason for sharing this information is to inspire you to start taking your own blog seriously. I found other food blog income reports from bloggers like Pinch of Yum, Making Sense of Cents, and Kate Kordsmeier of Root + Revel very inspirational in my own food blogging journey. Their posts have been invaluable over the last year when I was low on inspiration and needed a push to keep going.
I especially want to share because so many blog income reports are from established bloggers who are raking in tens of thousands of dollars, and I want to show what realistic growth (and the inevitable plateaus) look like when you’re also working a full time job. No one starts out bringing in the big bucks, it happens with time and consistency.
The other reason for sharing is a bit more selfish: while I’ve done well creating new content and mastering food photography, I haven’t been great at tracking my own progress and setting attainable monetary and business growth goals. I have a ton of ideas for the blog, but sometimes not a lot of follow-through due to time restraints and not knowing where to start on everything I want to accomplish. Sharing my monthly food blog side hustle reports with you is a way for me to stay accountable.
In these reports I share a month-by-month analysis of what I’m working on, how the blog has grown, what’s working and what isn’t, and my goals for the future. I share this to stay accountable and so that you can learn and be inspired to keep going with your food blog journey as well.
💰 July 2020 Income Report
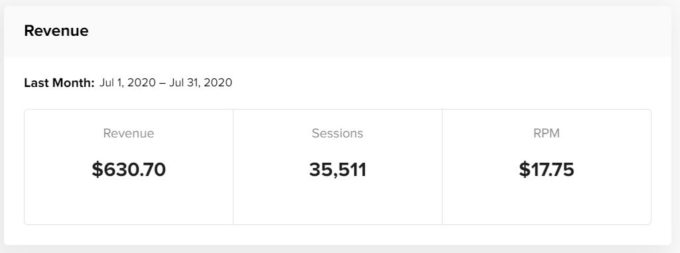
TOTAL INCOME: $1047.14
- Display ads: $630.63 (Mediavine)
- Affiliate Marketing: $116.51
- Bluehost: $65.00
- Feast Design Co: $25.00
- Amazon Associates: $19.51
- Food Blogger Pro: $7.00
- Sponsored Posts: $0
- Freelance Writing, Photography, Design: $300
TOTAL EXPENSES: $135.03
- Website Upkeep: $62.08
- Website hosting: $11 (Cloudways)
- Website tech/development: $47 (iMarkCreative)
- Tasty Links: $4.08* (automatic linking plugin)
- Photography + Video: $9.99 (Adobe Creative Cloud)
- Email service provider: $29 (ConvertKit)
- Content + social media management: $33.96
*Expenses listed with an asterisk are paid annually to take advantage of annual discounts, but I include the monthly amount here to show how much the blog costs to run each month.
**Expenses listed with two asterisks are those that I paid for last month but decided not to pay for going forward. I leave these here for the first month I don’t pay for them to show how I am cutting expenses month-to-month.
NET PROFIT: $912.11
Income + Expense Review
Let’s talk about income…
If you’ve been reading other food blog income reports, you’ll know that no two blogs monetize in the same way. Some are high traffic with high display ad earnings, some are killing it at affiliate marketing, and some sell their own products and courses. And some are doing a little bit of everything.
Let’s dive a bit deeper into the way Fork in the Road created income in July 2020.
Display Ads
Traffic is heading up for Fork in the Road (see traffic report below), which means an increase of display ad income!
July ad RPMs stayed pretty steady in the $15-22 range throughout the month, which rounded out Fork in the Road’s average RPM at $17.75 for July 2020.
Ad rates are typically lower at the start of the business quarter as companies are just beginning to dip into their ad spend budgets, which means that July (the beginning of the third quarter) was lower than the end of June (the end of the second quarter).
However, out of curiosity I checked my RPMs from July 2019, and the average was $13.79. So one year later my average was $4 more, which is great considering my traffic isn’t much higher than it was last year.
Affiliate Marketing
Affiliate marketing is when a blogger promotes another brand’s product or service and receives a small commission if the reader purchases after clicking through an affiliate link. In July 2020 FITR made $116.53 in affiliate income from various affiliate programs.
Amazon affiliate income continues to go down, but to be honest I really don’t put much effort into this program (or any, if you want me to be frank) so I’m ok with where it’s at for doing absolutely nothing.
I also had a few sales from blogging services that I recommend in my food blog resources posts, which meant an slight uptick in affiliate income this month. All of these services are those I know and trust, which makes talking about them in my food blogging resources posts a natural fit.
I still have a ton of ideas for affiliate marketing, but sitting down and actually doing the work has been a struggle.
Sponsored Posts
I’m currently not pursuing sponsored post work. If I was approached by a company that aligned with the site, I would definitely work with them, but right now I’m not using my limited time to pitch sponsored work to brands.
Freelance Writing + Photography
Freelance writing and photography is any content I create for brands or other bloggers. Even though this type of work means the content never ends up on Fork in the Road itself, I still include it in these income reports because without the blog serving as my portfolio, I would never have secured the work.
In June 2020 I made $300 from freelance photography, which should be about the same amount in months going forward. It’s an easy and fun project, as I get to shoot photos outside of my typical style, which I find builds my photography skills overall.
Income Takeaway
July 2020 income is the first time I have hit the $1000 mark in a few months, which is a nice feeling. I like seeing the numbers go up each month, but I’ve also been paying more attention to the site’s expenses as well to see a higher take-home percentage than I have in the past.
Let’s talk about expenses…
What you can see from my expense breakdown is that running a food blog means spending money to keep the blog running. I consider these costs of doing business, and because I work a full-time job as well as run the blog I outsource some things like tech management and use tools to automate tasks like social media and emails to my mailing list.
Also, many of the expenses you see listed in this expense report are things that I pay annually, so I have divided out the monthly cost to give an idea of what it costs to run the blog each month. Before doing this for these income report posts, I was spending upwards of $200+ on the website each month.
Over the last few months I have slowly cut away some things I have more time to do now to reduce monthly expenses. In July 2020 I decided not to continue paying for CoSchedule (which is crossed out in my expenses list), a social media scheduling tool and editorial calendar that I rarely used.
Is Tailwind still worth it?
One call-out in my expenses that I want to discuss is how Pinterest has changed and whether or not Tailwind, a Pinterest planning software, is still worth using and paying for.
In July I began testing out using Pinterest’s native pin scheduler instead of using (and paying for!) Tailwind. I’ve really liked Tailwind in the past because they are a “set it and forget it” service that allows you to go in and schedule pins for months in advance.
However, now that Pinterest has a big push for fresh pins (or completely new pins, even for older content you’re sharing again) I decided to test out using their native pin scheduler throughout the month to see if it was something I could do moving forward so I don’t have to pay for Tailwind (which costs upwards of $100+ annually).
I can’t say that I have any specific revelations to share, only that my Pinterest traffic did go up by 20% in July compared to June. However, I did make a TON of new pins and would say that I posted about 5 new pins on average every day. I’ve never had a high amount of Pinterest traffic, so I’m finding it interesting to see what works and what doesn’t.
I decided not to renew my Tailwind annual plan and will continue to use Pinterest’s scheduler in August. I may decide to use it in the future, but for now the changes I’m seeing with Pinterest (fresh pins push, Story and video pins, creating a native scheduler and pin designer, etc.) make me think they want you to use their own site to create and share content.
Expenses Takeaway
The amount I spend monthly is probably pretty standard for most bloggers with a site my size. However, I’m actively trying to reduce costs where it makes sense and in July my expenses were about 10% lower than in June 2020.
📈 July 2020 Traffic Report
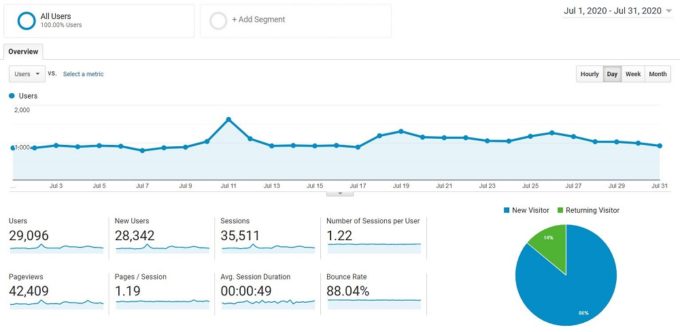
July 2020 total traffic: 42,409 pageviews
This is +34% from June 2020 last month and +7% from July 2019 last year.
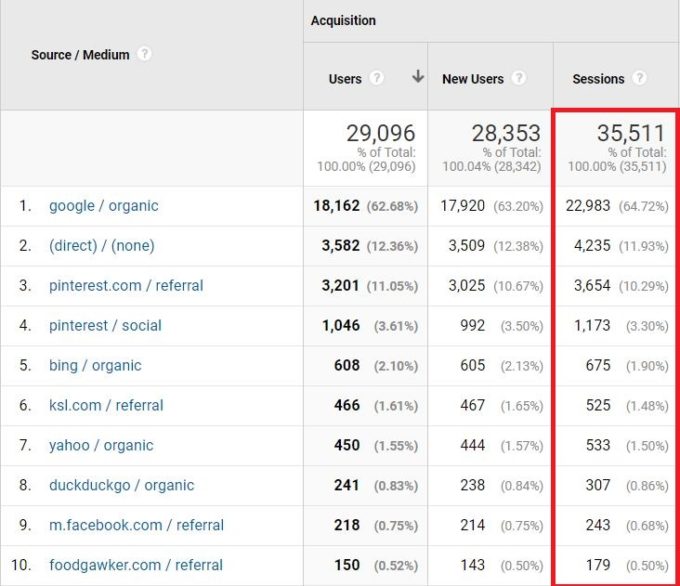
Top ten traffic sources for July 2020
New content on Fork in the Road in July 2020
- New recipe posts: 4 new + 1 updated recipe posts
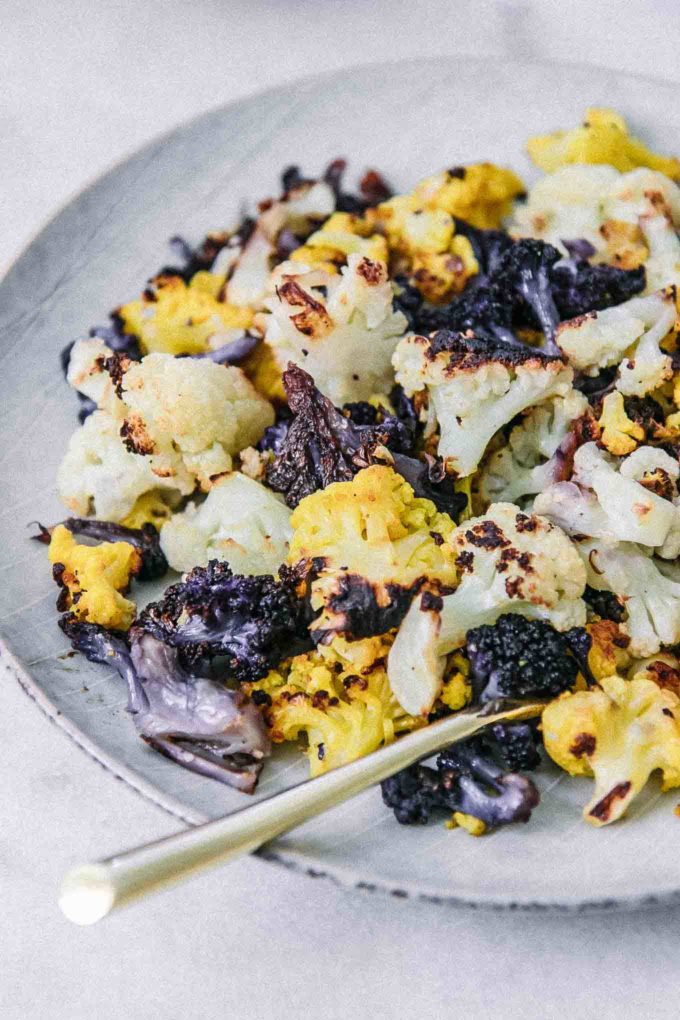
- Roasted Rainbow Cauliflower
- Southern-Style Vegan Potato Salad
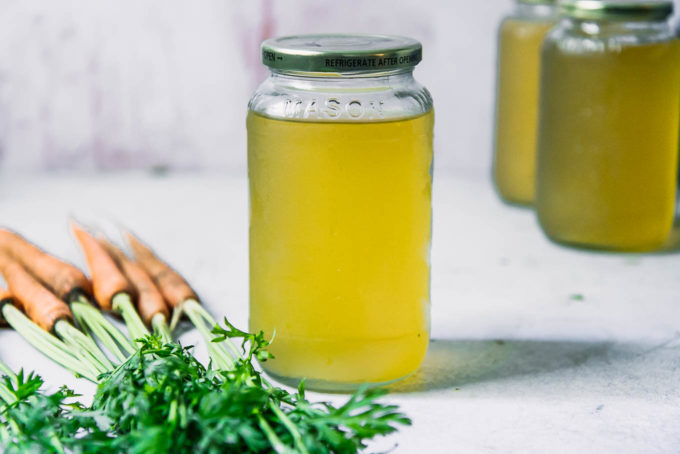
- How to Make Vegetable Broth from Carrot Tops
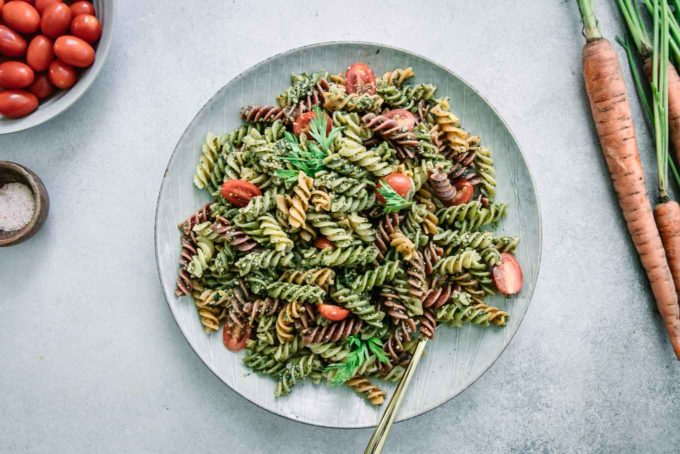
- Carrot Top Pasta
- Mexican-Style Three Bean Salad (updated)
- New green guides: 0 updated green eating guides
- New resources posts: 1 new food blogger resources
Traffic takeaway
I am ecstatic that July was such a better month than June! I was pretty down about the site’s lack of growth last month, but seeing a 34% increase in traffic is just the fire under my butt that I needed to keep this thing going.
One thing I need to remember for next year: June is not a great month on the blog. Even though I have a lot of summer recipes, people just aren’t searching as much in June and especially this year with the global pandemic and other crazy events that are making 2020 a total wash.
One thing I’m seeing that’s working on the site is something I touched on last month, which is really understanding search engine optimization and user intent. I thought I really understood keyword research in the past but after joining some blogging forums that are outside the food and recipe niche, I’m learning a lot about how people search and how to optimize your site to provide readers with the information they need.
Writing for search intent and locating under-served keywords is working and I’m excited to see what happens moving forward as I create more content with this in mind.
💌 Email List Growth
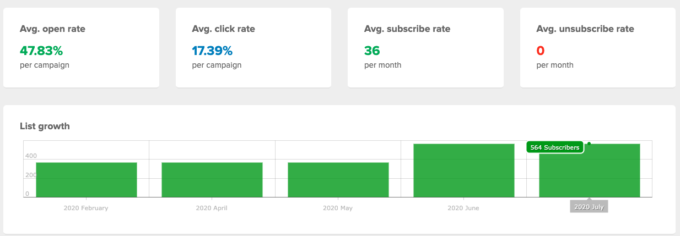
598 subscribers (+34 net new subscribers in June 2020, 5% growth)
Email Takeaway
Last month I mentioned being stuck between email service providers (ESPs) and listed what I liked and didn’t like about specific services from the three ESPs I was contemplating.
After writing it out I realized that my back and forth was ridiculous because the answer was obvious: use the cheapest service that allows you to do what you need. Which in my case is just collect emails, send simple emails and newsletters, and build a landing page here and there.
That means I decided to go with Mailerlite. I was paying $29/month for Convert with 500+ subscribers and with Mailerlite that same number is free. That’s a no-brainer.
When I switched over my on-site forms and created a few slide-in popups I began seeing an uptick in signups, which made for about 10% growth in July. I haven’t been great about being consistent with sending emails, but maybe that’s a goal for the future.
💸 July 2020 RPM: $24.69
What is RPM? RPM is Revenue per Mille, or the amount of revenue per 1,000 pageviews. The formula for RPM is: (estimated earnings / number of pageviews) * 1000. In July 2020 I earned $1047.14 and had 42,409 pageviews, which means my RPM was $24.69. This means that for every 1000 pageviews I received, I made $24.69.
📌 July 2020 Summary + Goals
My goal for July 2020 was to create more content, specifically 15 posts. I did not reach that goal (I posted/updated 7 posts), but I had a good reason….
I went back to work full-time!
I mentioned in my May 2020 report that I, like so many people right now, was furloughed from work. I wasn’t sure when or if I would have a job to go back to moving forward so I wanted to try to take the blog income to the next level.
However, work came calling to have me back and I was more than happy to say yes. I work full-time as a registered dietitian in a nutrition and culinary marketing position for a company in the food service industry that is doing great sustainability work. So it’s a great fit for my interests and skills, with great people, and I was happy to go back.
This means the blog is still my side hustle, and I can continue to grow it in my (non-existent) free time. My time as a “full-time blogger” lasted about 4 months and showed me that I crave financial security and the website just isn’t able to provide me that…yet. So we trudge ahead.
Looking forward to August 2020
I will continue to focus on what I can do every day to grow the site, and that’s create more content strategically.
- Content, content, content. My focus is posting more content. Not social media (besides Pinterest). Not reading blogs. It’s pressing publish as often as possible.
- Consistency. Writing is my roadblock, so I will continue to try to write for 1 hour a day to keep the writing muscle going.
- Video! I plan to start creating a few recipe videos each month to add to my website to increase my RPMs with Mediavine. I won’t put a number on how many, I just hope to have at least one finished by the end of August.
Thanks for sticking it out and reading Fork in the Road’s July 2020 journey!
Make sure to check out the Food Blogging Resources page for past income reports and blogging tips, and sign up below to receive emails when new reports and blogging resources are live.
[mailerlite_form form_id=4]Do you have a food blogging question you want answered in a future report? Want to commiserate on your own blog traffic or income? Leave a comment below or contact me!