August 2021 Food Blog Side Hustle Income Report: $3,263.73
How my part-time food blog side hustle made $3,263.73 in August 2021! I share my strategies for taking your blog side hustle from hobby to business one post, and one month, at a time.
Want to Save This Recipe?
Enter your email & I’ll send it to your inbox. Plus, get new plant-based recipes in your inbox!
By submitting this form, you consent to receive emails from Fork in the Road.
Welcome to the August 2021 Fork in the Road income report! If this is your first time reading one of our monthly traffic and income reports, my name is Kristina and I am a registered dietitian and the face behind this plant-based recipe and sustainable kitchen blog. Find out more about the site and the content shared on Fork in the Road here.
If you’re new to my income reports, make sure to check out my last update — July 2021 food blog income report — to get caught up.
Ready to learn how Fork in the Road grew in June? Read on for my income and traffic report, my analysis of what worked (and what didn’t) and the goals I’m working toward in months to come.
If this is not your first time reading a Fork in the Road income report, you can skip this section and head right to the income and traffic report below.
You might be wondering why I am sharing how much money I make from my food blog with the world. Why would I want to put myself out there and share the nitty gritty details of the money this blog is bringing in?
The main reason for sharing this information is to inspire you to start taking your own blog seriously. I found other food blog income reports very inspirational in my own food blogging journey, and reading about other bloggers’ successes (and failures) has been invaluable over when I was low on motivation and needed a push to keep going.
I especially want to share because so many blog income reports are from established bloggers who are raking in tens of thousands of dollars, and I want to show what realistic growth (and the inevitable plateaus) look like when you’re also working a full time job. No one starts out bringing in the big bucks, it happens with time and consistency (the latter of which I sometimes lack!).
The other reason for sharing is a bit more selfish: while I’ve done well creating new content and mastering food photography, I haven’t been great at tracking my own progress and setting attainable monetary and business growth goals.
I have a ton of ideas for the blog, but sometimes not a lot of follow-through due to time restraints and not knowing where to start on everything I want to accomplish. Sharing my monthly food blog side hustle reports with you is a way for me to stay accountable.
In these reports I share a month-by-month analysis of what I’m working on, how the blog has grown, what’s working and what isn’t, and my goals for the future. I share this to stay accountable and so that you can learn and be inspired to keep going with your food blog journey as well.
💰 August 2021 Income Report
Below is a table showing revenue, pageviews, and content posted for each month of the last year. I keep this table updated to show incremental income increases (and temporary setbacks) over the course of a year.
| Month | #Posts | #Views | $Ads | $Affiliate | $Other | $Total |
|---|---|---|---|---|---|---|
| Aug-20 | 3 | 49,495 | $917.18 | $46.20 | $300 | $1,263.38 |
| Sep-20 | 5 | 42,190 | $959.19 | $49.46 | $250 | $1,258.65 |
| Oct-20 | 6 | 43,508 | $1,340.78 | $49.46 | $250 | $1,640.24 |
| Nov-20 | 4 | 45,683 | $2,024.79 | $79.85 | $150 | $2,254.64 |
| Dec-20 | 4 | 53,027 | $2,605.78 | $98.94 | $250 | $2,954.72 |
| Jan-21 | 19 | 61,107 | $1,737.18 | $315.99 | $0 | $2,078.17 |
| Feb-21 | 4 | 54,754 | $1,694.57 | $89.03 | $0 | $1,783.60 |
| Mar-21 | 1 | 70,851 | $2,308.82 | $23.97 | $0 | $2,332.79 |
| Apr-21 | 8 | 70,013 | $2,293.14 | $73.92 | $0 | $2,367.06 |
| May-21 | 14 | 80,015 | $2,912.53 | $50.89 | $0 | $2,963.42 |
| June-21 | 13 | 71,971 | $3,177.92 | $201.13 | $0 | $3,379.05 |
| July-21 | 16 | 82,509 | $3,374.50 | $5.33 | $0 | $3,379.83 |
| Aug-21 | 16 | 78,190 | $3,224.28 | $12.45 | $0 | $3,263.73 |
TOTAL INCOME: $3,263.73
- Display Ads: $3,224.28 (Mediavine)
- Affiliate Marketing: $12.45 (Amazon Associates)
TOTAL EXPENSES: $1404.14
- Website Upkeep Total: $72
- Website hosting: $11 (Cloudways)
- Website tech/development: $47 (iMarkCreative)
- Tasty Links: $4* (automatic linking plugin)
- Photography + Video Total: $42.94
- Adobe Creative Cloud: $29.99
- Canva: $12.95
- SEO + Keyword Research Tools Total: $37
- SEMrush: $25 (shared account with other bloggers)
- Keysearch: $12
- Email service provider: $79* (Kartra)
- Content + social media management: $14.95
- Tailwind: $14.95*
- Learning (courses, ebooks, memberships, etc.): $308.25
- HashtagJeff SEO membership: $8.25*
- Creative Course Collective: $300*
- Writer + Virtual Assistant: $850.00
+Expenses with a plus sign are new for the month and explained in the expense review below.
*Expenses listed with an asterisk are paid annually to take advantage of annual discounts, but I include the monthly amount here to show how much the blog costs to run each month.
**Expenses crossed out are those that I paid for last month but decided not to pay for going forward. I leave these here for the first month I don’t pay for them to show how expenses change month-to-month.
NET PROFIT: $1,859.59*
*Note that the numbers here are an estimate and are not reflective of actual money in and out for the month. I report money earned, not received, for the current month as my ad company pays two months after money is earned. I am also showing a breakdown of expenses to give you an idea of how much it costs to run a blog every month, however many of these are paid annually and not monthly.
Income + Expense Review
Let’s talk about income…
Display ads continue to be my favorite form of income because, well, it’s basically the only form of income the blog has right now (I’m working on other streams as we speak!).

RPMs continue to be outstanding with Mediavine, which I can’t complain about. And they will only continue to rise as we round out quarter 3 and start quarter 4 (the most exciting time of the year!).
While there isn’t much to update on income in general, I do want to call your attention to the table outlining the last 12 months of income at the top of this income section.
I started this table in August 2020 to give a good overview of how income increases (and sometimes decreases) over the course of a year. I love seeing how it slowly increased over time, and also how as I started to post more content each month that we see some bigger jumps.
When comparing August 2021 to August 2020, it’s almost exactly a $2000 increase to the dollar…which is a 150% increase in one year. If I can do this every year then I’m very excited to see what the future holds!
Expenses Takeaway
July’s expenses were normal, though outsourcing was a bit lower because I was very busy at my full-time job and wasn’t able to devote time to get tasks out to my team.
Having a writer and a virtual assistant has been so incredibly helpful, but I have to remember that they’re relying on me for tasks to complete and I have to be consistent with creating work for them.
If you’re considering outsourcing, know that it is absolutely worth it but that doesn’t mean that’s it’s 100% hands-off and you can ghost on your blog for weeks at a time (because that’s what I used to do when life was too hectic to make time for blogging).
📈 August 2021 Traffic Report
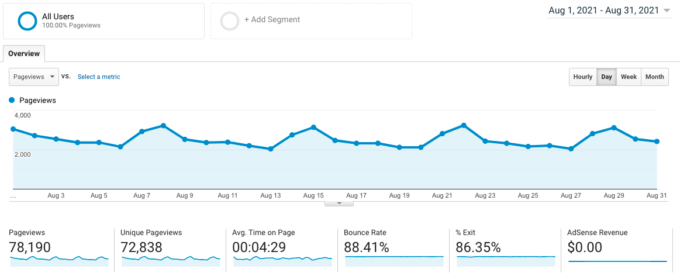
July 2021 traffic: 78,190 pageviews
This is -5% from July 2021 last month and +61% from August 2020 last year.
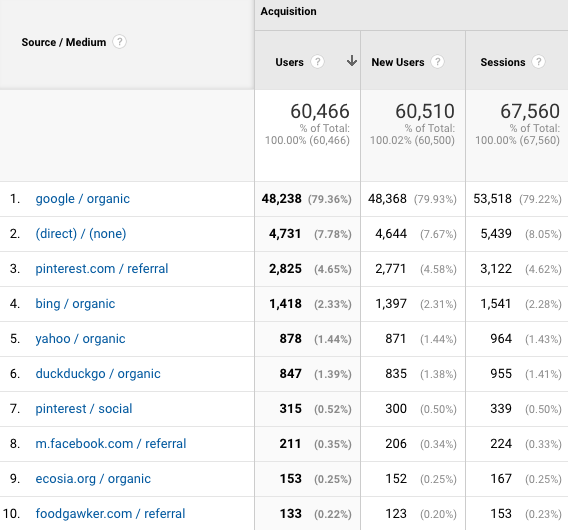
Top ten traffic sources for August 2021
New content in August 2021: 16 total posts
- New recipe posts: 3 new recipes, 11 updated older recipes (new photos, complete rewrites)
- New green guides: 1 new green living guide
- New resources posts: 1 new blogging resource (income report)
- New videos: 0
Traffic takeaway
August was another great month for traffic. It was one of the highest months the site has ever seen, seeing a slight 5% decrease from July for about 78,000 pageviews.
Traffic has been a bit of a rollercoaster since March and has been hovering between 70,000 and 80,000 pageviews for the last 6 months.
Typically this would frustrate me, but since March through August are usually the lowest months of the year for food blogs, I’m actually calling this my new low season benchmark (which is a win!).
💌 Email List Growth
~1350 subscribers (+100ish new subscribers in August 2021)
I gained about 100 or so new email subscribers in July, for a total of about 1350 total subscribers. However, this is a VERY COLD list. I have not communicated with them for months (years?) and I suspect many would unsubscribe when I send out a new email.
💸 August 2021 RPM: $37.04
What is RPM? RPM is Revenue per Mille, or the amount of revenue per 1,000 pageviews. The formula for RPM is:
RPM = (estimated earnings / number of pageviews) * 1000
($3,263.73/ 78,190) * 1000 = $41.74
In August 2021 the blog earned $3,263.73 and had 78,190 pageviews, which means the total RPM for all income sources was $41.74. This means that for every 1000 pageviews the blog received, it generated $41.74 (note that this number is actually lower than my ad company RPM totals because my ad company takes a percentage of my earnings).
👩💻 Other Sites
Though I absolutely LOVE Fork in the Road and it will always be my blogging baby, my goal is to have a portfolio of websites and I even want to test the waters with buying and flipping websites in the future.
Below is an update on other blogs I have started, and I hope to flush this section out more as I dive into more projects.
Site #2: Recipe Blog Partnership
August 2021 was the second month that my second blog was live. This is a recipe blog partnership with Val from Thyme and Joy, which I covered for the first time in last month’s income report.
There’s not much to report for August for this project, other than we’re continuing to drip out new content as we can. I want to emphasize as we can, because August seemed to be a month that threw us both through a loop (I talk more about this in my summary below).
So to summarize, the website now has a total of 14 recipes and in August we officially set up analytics and submitted it to Google Search Console so we can track keywords and rankings.
It’s getting impressions and received a whopping 78 pageviews, which means only one thing: keep pressing publish.
📌 August 2021 Summary + Goals
Since there wasn’t anything major to report in August — no major algorithm updates or other problems out of leftfield — I will touch on something that impacted me, and in turn impacted the blog(s): blogger burnout.
Things really came to a head in the beginning of August with work ramping up for my full-time job, and my toddler and I both getting sick twice in six weeks. Then add to that the oppressive smoke from the California fires and multiple weeks of 100+ degree temperatures so we couldn’t leave the house, and you have yourself a recipe for burnout.
I knew it was time to take a break and pare things back to what actually needed to get done to keep the blog alive, so I stopped shooting photos for new recipes and switched the team to only updating older posts that didn’t require as much active work from me.
So because of this every update I’ve published for the last three weeks is actually not new content, it’s a complete rewrite of older posts that I’ve had on my list to rework but hadn’t gotten around to. This is important work that needed to get done, so I’m actually fine with taking a step back from new content for awhile.
In fact, both Valerie (my blogging friend/business partner in the second blog Valerie) and I were experiencing very similar setbacks this past month so we decided something that goes against what most bloggers do: we’re going to take blogging breaks from now until the end of the year.
Now, this doesn’t mean that I’m not blogging. I’m just not going to approach it with the same urgency I had before.
I’m still sticking to an every other day posting schedule when I can, but I’m not focusing on pushing out new content and I’m not taking on any new projects unless I really feel called to do it.
This might sound crazy since the busiest time of year is coming soon, but it feels intuitive to me. I spent the first half of this year really buckled down creating new content, systems, and strategies for the site and now it’s time for me to relax a bit and see the hard work come to fruition.
Fall and winter is usually a busy time of year for family and for work, so being a bit less focused on blogging feels like the best way to give myself the mental space to enjoy the holidays instead of freaking out about getting more, more, more content out the door.
Goals update
Augusts’s blogging goals were:
- Continue to post every other day
- Stay one week ahead on content
- Simplify my systems a bit, I have too many things in too many places
September’s blogging goals are:
- Continue to post regularly, for a total of 16 posts for the month
- Only focus on updating older content to give myself a mental break from creating new content
I’m keeping it simple again for September and am holding space to live life a bit and not be too focused on blogging and creating. It feels nice to give myself that permission.
If you’d like to follow along on my journey, sign up below for email updates!
Thanks for sticking it out and reading Fork in the Road’s journey!
Make sure to check out the Food Blogging Resources page for past income reports and blogging tips, and sign up below to receive emails when new reports and blogging resources are live.
Do you have a food blogging question you want answered in a future report? Want to commiserate on your own blog traffic or income? Leave a comment below or contact me!

